Scatter Plots and Line of Best Fit
by Math Down Under © 2024
Price: $3.5 USD
Subjects: math,mathMiddleSchool,statisticsAndProbability,bivariateData
Grades: 8,9,10
Description
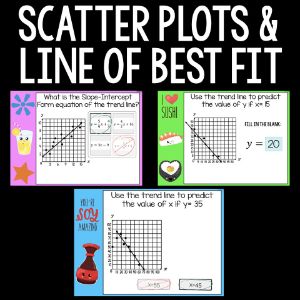
Give students hands-on practice with analyzing scatterplots and interpreting trend lines in this interactive 24-card Boom Deck! Students will identify associations (positive, negative, none), estimate slope and y-intercept, write equations in slope-intercept form, and use the line of best fit to make predictions - all in a variety of engaging formats: multiple choice, drag and drop, fill in the blank, and click-to-answer. Each card includes: -Visual scatterplots with guided prompts for analysis -Practice identifying patterns and relationships in bivariate data -Opportunities to estimate slope, write equations, and interpret trends This resource supports: -Understanding and analyzing linear relationships in scatterplots -Applying slope-intercept form -Making predictions using the line of best fit Perfect for: -8th grade statistics and data unit -Students who need hands-on, visual learning supports -Independent work, stations, early finishers, or spiral review -Classrooms looking for differentiation and engagement
Acknowledgements
Fonts: Bunny on a Cloud Clipart: CatAndMe