Middle School Science Graph Analysis Interpreting Data
by Classroom 214 © 2021
Price: $4 USD
Subjects: science,statisticsAndProbability,mathMiddleSchool,physicalSciences,lifeScience,earthAndSpaceScience,appliedScience
Grades: 5,6,7,8
Description
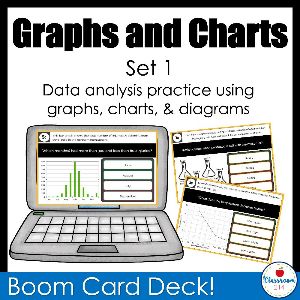
Data and graphing practice to help science students master analyzing data. Each data graphing set includes a chart or diagram and 5 analysis questions. Perfect for state test prep! Includes Earth, life, physical, and general science topics. Use with Google™ Slides or print them out. Sub friendly! The deck contains 10 different data sets. Each data set includes five comprehension and analysis questions to help students practice understanding and interpreting data. Each colorful slide includes a brief introduction to the data, a copy of the data and a multiple choice question. There is one question per slide. Use them as a warm-up, bell ringer, test prep, in class assignment, or as homework! Answering just one question a day will take just the smallest bit of class time, but will keep your student's data analysis skills sharp! TYPES OF DATA CHARTS - Line graph - Bar graph - Data table - Diagram - Double line graph - Flow chart WHAT'S INCLUDE - 10 graphs, charts, data tables, and diagrams - Covers Earth, life, physical, and general science - 5 comprehension and data analysis questions for each chart Follow my store to hear about new decks and sales!
Acknowledgements
Digital paper provided by RedPepper