Scatter Plots and Trend Lines Escape Room: Make Predictions
by Creouts Publishing © 2026
Price: $3 USD
Subjects: math,mathMiddleSchool,statisticsAndProbability,data
Grades: 8,9
Description
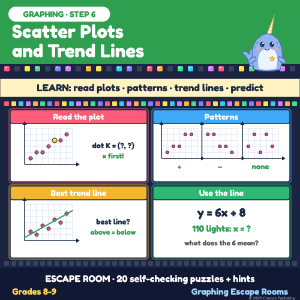
Students learn and practise: reading scatter plots, positive, negative and no association, linear and nonlinear patterns, clusters and outliers, choosing a good trend line, predicting from a trend line and its equation y = mx + b, and what m and b mean in context (Grade 8-9 level). STEP 6 of Graphing Escape Rooms: Transformations, Functions, Scatter Plots (6 escape rooms, bundle 20% off). Story: on Light Show Night at Kittle Cove Pier, Kiri the narwhal reads data plots to open the last light booth. 4 rooms, 30 cards. HOW IT WORKS - Room 1: read dots, the dot plotted wrong, count with two rules. - Room 2: which claim fits, curved or straight, outlier, clusters. - Room 3: the best of three lines, above vs below, predict y and x. - Room 4: predict with y = mx + b, meaning of m and b, actual vs predicted. SELF-CHECKING WITH HINTS 11 typed, 4 tile and 4 tap answers plus the lock. A learn card opens each room; two hints per puzzle. ACCURACY Software re-reads every card, reads each dot and line back from the grid and recomputes every answer, fit and count. Solved from the cards alone by separate AI test sessions. Not tested with a class. SOURCES Common Core 8.SP.A.1, 8.SP.A.2, 8.SP.A.3 (public standards; no copied text). Data are made up for learning. HOW IT WAS MADE Text written with AI help and checked. Pictures drawn in code. Needs internet. For learning only. All people and places are made up. Data are made up for learning.
Acknowledgements
Text fonts: Atkinson Hyperlegible, (c) Braille Institute of America, SIL Open Font License 1.1; Fredoka, (c) The Fredoka Project Authors, SIL Open Font License 1.1.