Data Review Escape Room: Publish the Bird Count Board
by Creouts Publishing © 2026
Price: $3 USD
Subjects: math,mathElementary,data,measurementAndData,measurement
Grades: 3,4
Description
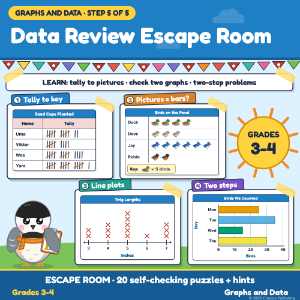
Students learn and practice: turning tallies into pictographs and choosing a key, checking a pictograph against a bar graph, line plots with bar graphs, fraction differences on a line plot, two-step word problems from graphs (Grade 3-4 level). STEP 5 of Graphs and Data for Kids (5 escape rooms, bundle 20% off). Story: Bird Count Week at Maplefern School. Dibble the chickadee helps Uma, Viktor, Wes, Yara and Zeke finish the Results Board and open the Results Board Box. HOW IT WORKS 4 rooms: tally to pictures; picture vs bar; line plot + bar; two-step problems. SELF-CHECKING WITH HINTS 8 typed, 7 tile, 4 tap answers plus the lock. A learn card per room; 2 hints per puzzle. Accessible: screen-reader text on every card; keyboard friendly. ACCURACY Software re-solves every answer from the drawn graphs; AI test sessions solved it from the cards alone. Not tested with a class. STANDARDS: Common Core 3.MD.B.3, 3.MD.B.4, 4.MD.B.4 SOURCES: Common Core State Standards for Mathematics (Measurement and Data) and its public Progressions documents, for skills only. No copied text. A math practice activity. All counts, measurements, people and places are made up for learning; they are not real survey or science data. Not affiliated with or endorsed by any school, standards body or bird-watching organization. HOW IT WAS MADE Text written with AI help and checked. Pictures drawn in code. Needs internet. For learning only. All characters and places are made up.
Acknowledgements
Text fonts: Atkinson Hyperlegible, (c) Braille Institute of America, SIL Open Font License 1.1; Fredoka, (c) The Fredoka Project Authors, SIL Open Font License 1.1.