[Free Sample] Picture Graphs & Bar Graphs *with audio*
by SynergizeLearning © 2021
Price: $0 USD
Subjects: math,specialed
Grades: 13,1,2
Description
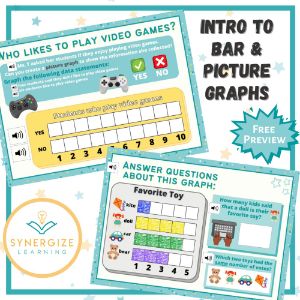
**NOTE: this is a small sample of a larger activity; full activity and different preview here: https://bit.ly/3jqSP2k The full activity introduces students to simple bar & picture graphs. Some slides (5 total) ask students to create graphs based on data provided, while other slides (6 total) ask students to answer questions by interpreting data from a graph. **audio of all questions & directions** CCSS.MATH.CONTENT.1.MD.C.4 - Represent and interpret data. Organize, represent, and interpret data with up to three categories; ask and answer questions about the total number of data points, how many in each category, and how many more or less are in one category than in another.
Acknowledgements
Creative Clips https://www.teacherspayteachers.com/Store/Krista-Wallden-Creative-Clips EduClips https://www.teacherspayteachers.com/Store/Educlips Pretty Grafik https://www.teacherspayteachers.com/Store/Prettygrafik Whimsy Clips https://www.teacherspayteachers.com/Store/Whimsy-Clips Zip-Ah-Dee-Doo-Dah Designs https://www.teacherspayteachers.com/Store/Zip-a-dee-doo-dah-Designs other visual media used via Canva's free use license