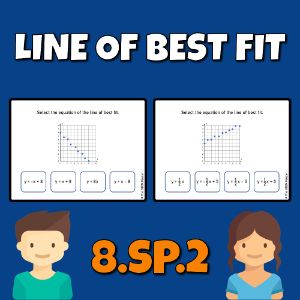
Scatter Plot Line of Best Fit 8.SP.2 8th Grade Statistics
Price: 300 points or $3 USD
Subjects: math,mathMiddleSchool,statisticsAndProbability,bivariateData
Grades: 8,9,10,11
Description: Grade 8 math statistics and probability deck covering creating a lines of best fit for scatter plots representing linear association between two quantitative variables Common Core CCSS 8.SP.A.2 8.SP.2